


The modern stock market moves fast, and keeping up with data can feel overwhelming. Prices change every second, trends shift quickly, and missing key information can lead to poor decisions. This is where Finviz steps in as a practical and visual-driven solution for market analysis. Designed to simplify complex financial data, Finviz helps users understand what’s happening in the market without unnecessary confusion.
Rather than relying solely on spreadsheets and raw numbers, Finviz focuses on visual clarity. It allows users to scan, compare, and analyze stocks efficiently, making it a popular choice among investors and traders who value speed and structure in their research process.
Understanding Finviz Beyond Just Charts

Finviz is more than just a charting website. It is a comprehensive stock research platform that organizes market data into digestible formats. Users can explore stock performance, sector movement, financial ratios, and technical trends from a single interface. The platform brings together essential market information and presents it in a way that supports faster decision-making.
What truly sets Finviz apart is how it balances depth with simplicity. Users do not need advanced financial knowledge to navigate the platform. At the same time, experienced traders can still extract meaningful insights using its advanced filtering and visualization tools.
Designed for Speed, Clarity, and Control

Finviz appeals to users who want quick answers without sacrificing accuracy. The layout is structured to reduce clutter and guide attention to what matters most. Important metrics are clearly visible, and switching between different views feels seamless.
Instead of digging through multiple sources, users can rely on Finviz as a central hub for market research. This efficiency makes it particularly valuable during volatile market conditions, when timing and clarity are critical.
Discovering Opportunities With the Finviz Screener
The screener is one of the most widely used tools on Finviz because it allows users to filter the market with precision.
- Stocks can be filtered using valuation data, price performance, or technical signals.
- The filtered results help users focus only on stocks that match their specific strategy.
This feature transforms hours of manual research into a few targeted clicks, making it easier to identify stocks worth deeper analysis.
Seeing the Market Through Visual Heatmaps
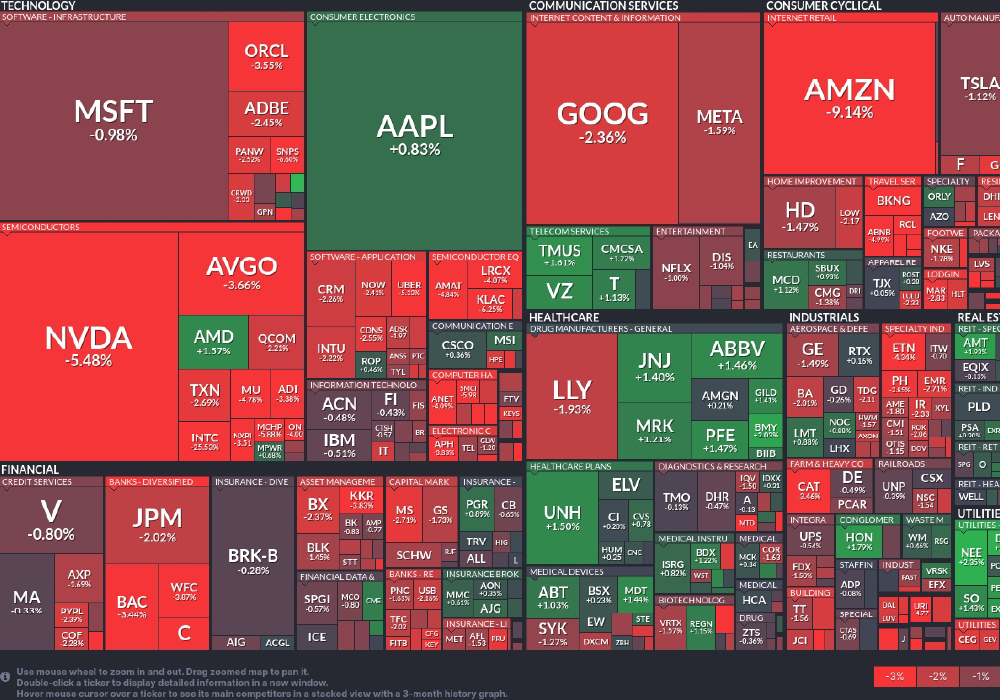
Finviz uses heatmaps to show how different stocks and sectors are performing in real time. These heatmaps rely on color intensity to indicate gains or losses, allowing users to grasp overall market sentiment almost instantly.
This visual overview is especially useful for identifying sector strength and weakness. Instead of reading long reports, users can quickly see where market momentum is building and where it is fading, making heatmaps an effective tool for big-picture analysis.
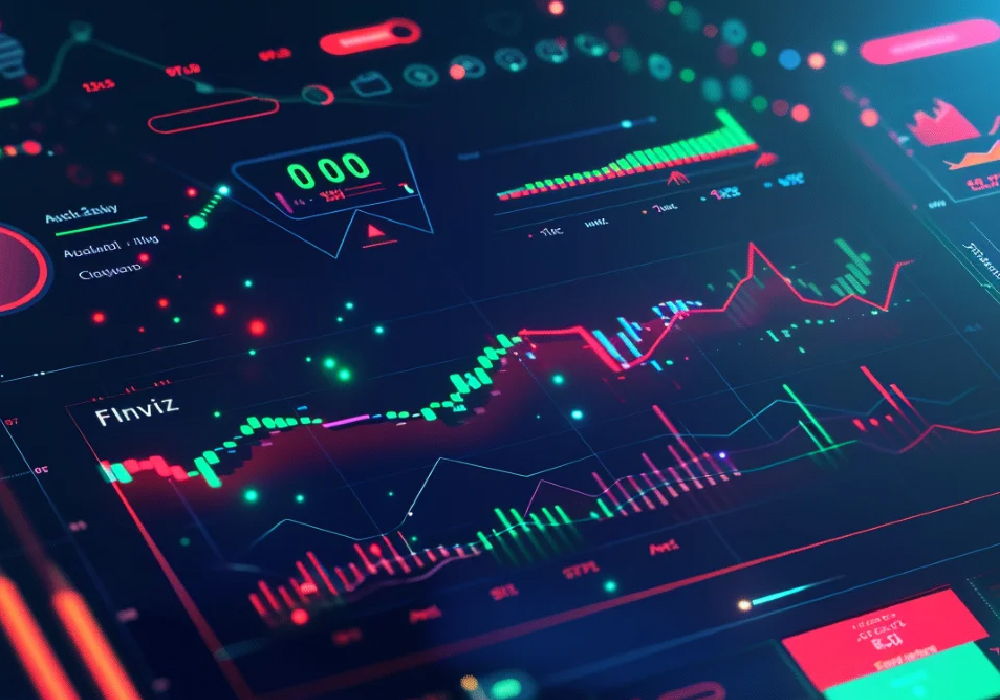
Simplified Technical Analysis With Interactive Charts
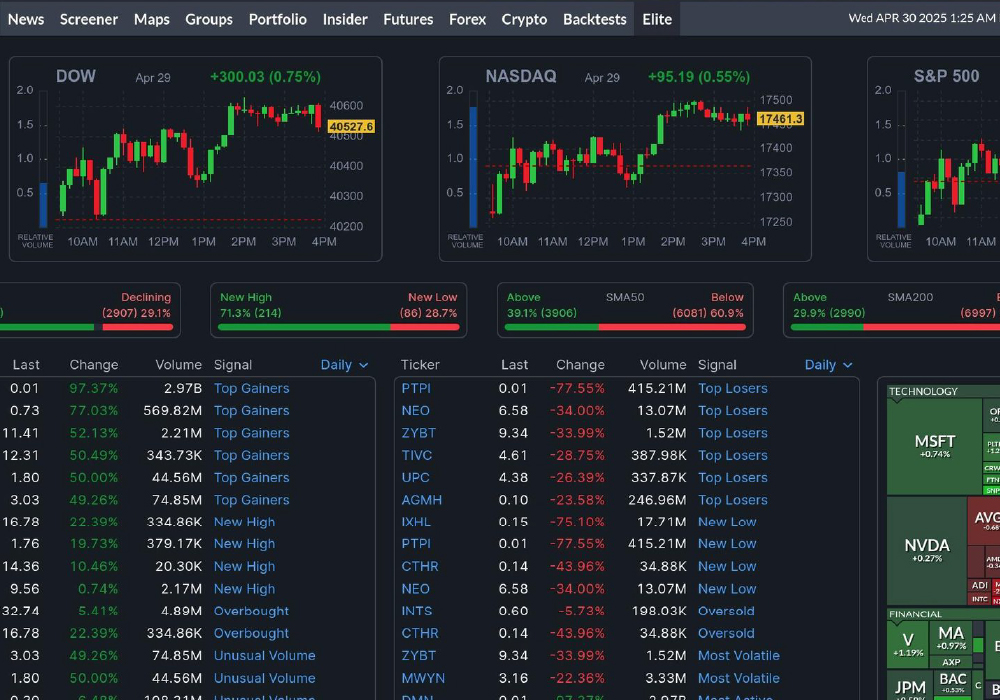
Charts play a key role in understanding price behavior, and Finviz keeps them clean and readable. Users can observe trends across multiple timeframes and apply commonly used indicators without complexity. The charts focus on usability rather than overwhelming customization.
This approach makes technical analysis approachable. Traders can evaluate price movements, identify patterns, and confirm trends without switching between multiple platforms or tools.
Market News and Insider Signals in One View
Finviz enhances analysis by combining price data with contextual information.
- Market-related news is displayed alongside stock performance.
- Insider trading activity highlights buying or selling actions by company executives.
This additional layer of information helps users understand why a stock may be moving and whether internal confidence aligns with market trends.
Choosing Between Free Access and Advanced Features
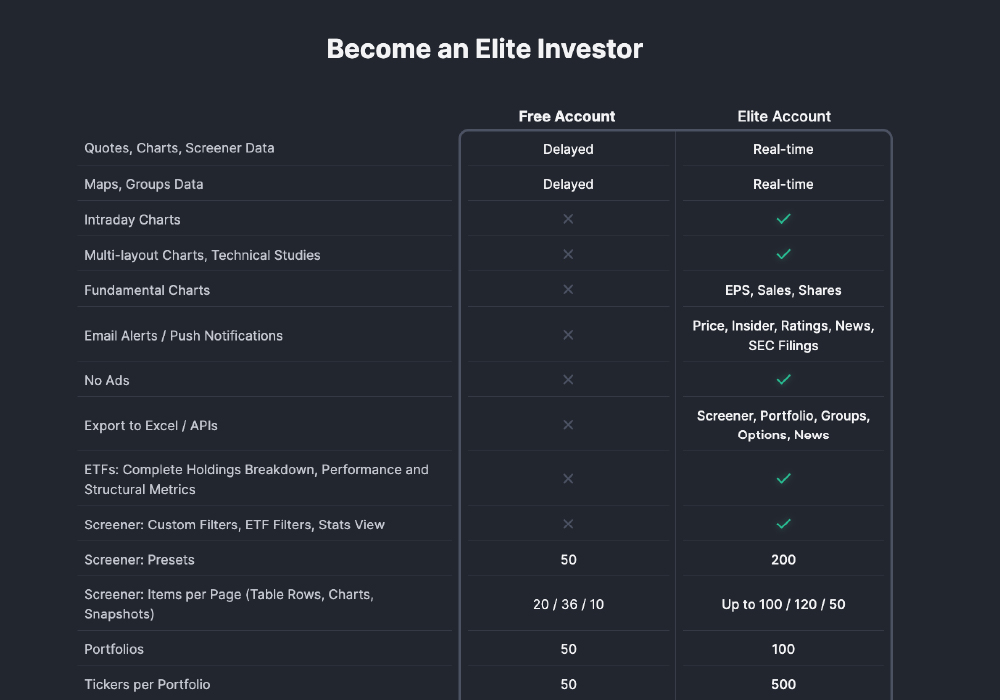
Finviz offers strong functionality even in its free version. Users can access screening tools, charts, heatmaps, and delayed market data without any cost. This makes the platform accessible to beginners and casual investors.
For those who need more precision, the premium option offers real-time data, advanced charting tools, and enhanced customization. Active traders often prefer this version due to its faster data delivery and expanded analytical depth.
A Platform Built for Many Trading Styles
One of Finviz’s biggest strengths is its flexibility. It caters to different types of users without forcing a one-size-fits-all approach. Long-term investors can focus on fundamentals and valuation, while short-term traders can rely on technical signals and momentum indicators.
Because of this adaptability, Finviz works well for anyone looking to develop or refine their market strategy over time.
How Finviz Encourages Better Market Decisions

Finviz supports disciplined investing by presenting data in a structured and logical way. It reduces emotional reactions by replacing guesswork with visual evidence and measurable criteria. Over time, users learn to rely on patterns, metrics, and trends rather than impulses.
The platform encourages consistency in research, which is essential for building confidence and improving long-term results in the stock market.
Closing Perspective
Finviz has positioned itself as a reliable and efficient tool for stock market research. Its emphasis on visualization, combined with practical screening and analysis features, makes it a valuable resource for modern investors.
For anyone seeking a clearer understanding of market movements without unnecessary complexity, Finviz offers a balanced and accessible solution. It turns scattered financial data into structured insights, helping users approach the stock market with greater confidence and clarity.
Visit Site