


In today’s fast-paced business world, data is everywhere, but making sense of it is often the challenge. Static spreadsheets and reports are no longer enough. Businesses need platforms that help them visualize, explore, and act on data quickly. Tableau empowers teams to turn raw information into meaningful insights through interactive, visual analytics.
This blog dives into the power of business intelligence, Tableau’s key capabilities, subscription models, and why it has become a cornerstone of data-driven organizations.
From Chaos to Clarity: Visualizing Your Data Universe
Organizations generate massive amounts of data daily, from customer interactions, sales, and operations to marketing campaigns. Spreadsheets can summarize data, but spotting trends, anomalies, and relationships often remains hidden.
Tableau transforms chaos into clarity with visual, interactive dashboards. Users can quickly explore patterns, ask “why” and “what if” questions, and move beyond static reporting to dynamic decision-making.
The Story Behind Every Chart: Tableau as a Data Narrative Tool
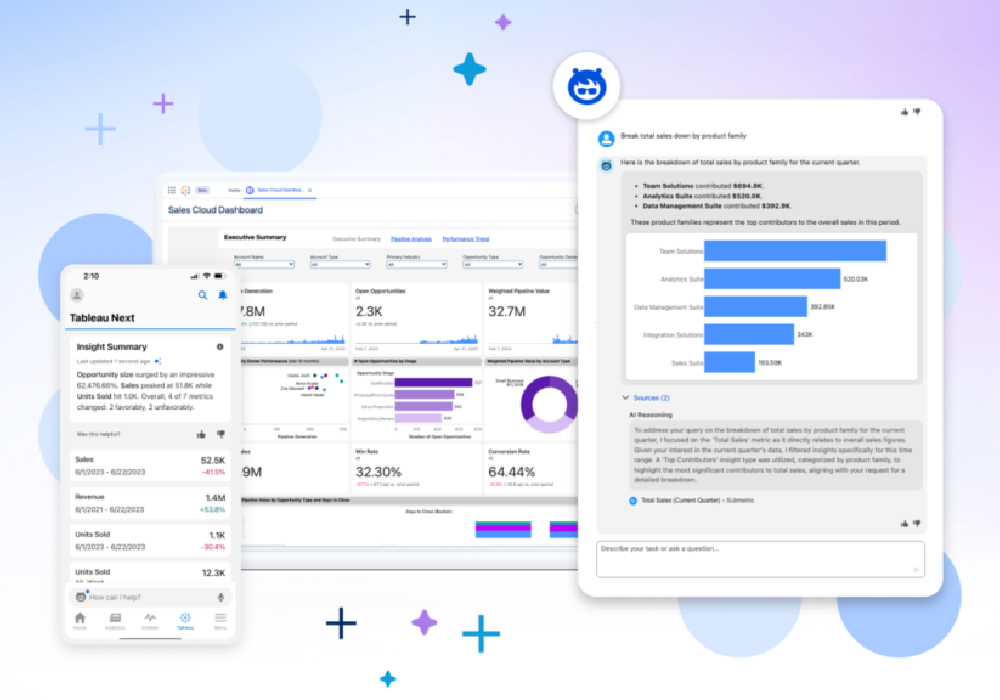
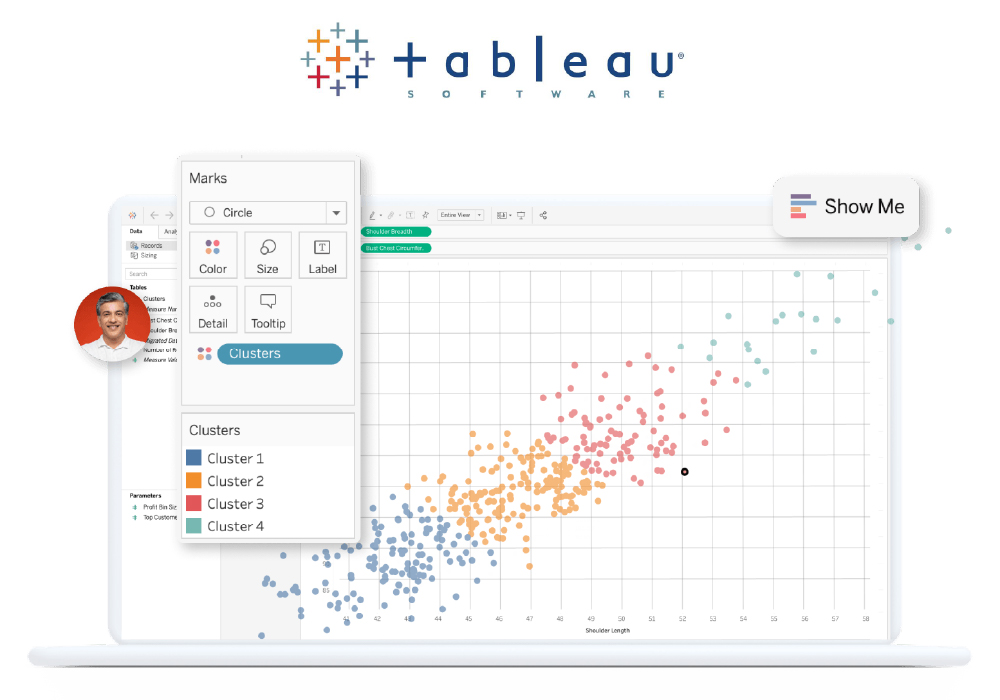
Tableau isn’t just about graphs, it’s about storytelling. By converting numbers into visuals, it allows teams to understand the narrative behind data.
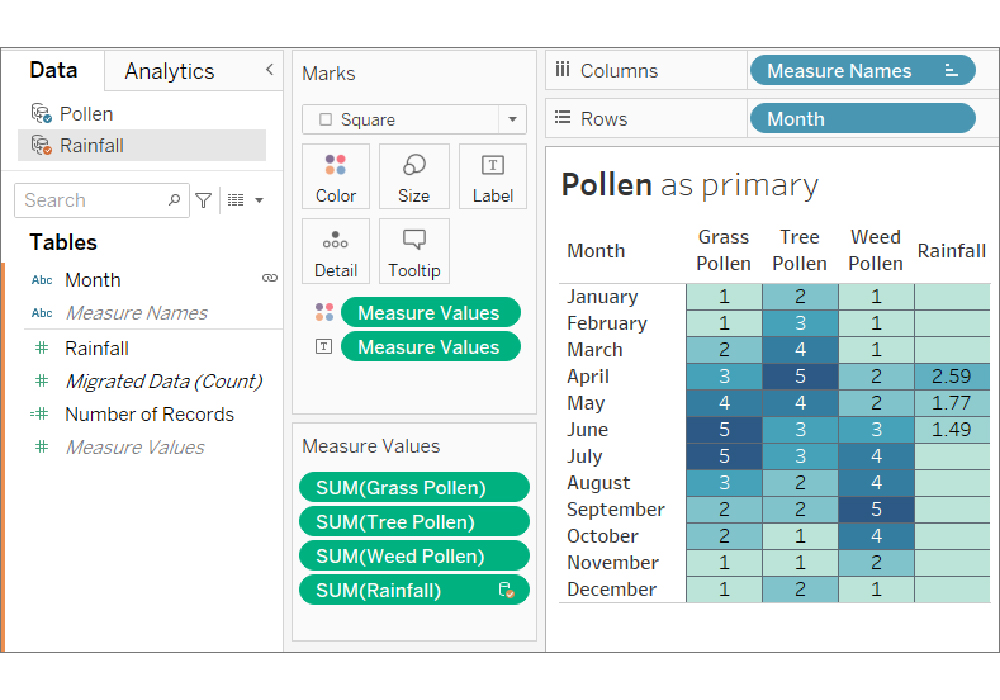
From heat maps and scatter plots to layered dashboards, Tableau helps users uncover insights that can inform strategy. Interactive features such as filters, drill-downs, and side-by-side comparisons make the story clear for analysts, managers, and executives alike.
Connecting Every Dot: Integrating Multiple Data Sources
One of Tableau’s most powerful features is its ability to unify data from multiple sources. Whether it’s cloud databases, spreadsheets, or enterprise applications, Tableau brings all data into a single workspace for seamless analysis.
This unified approach allows teams to see connections, trends, and correlations across datasets that were previously siloed, enabling informed decision-making across the organization.
Interactive Insights: Empowering Teams to Explore Freely
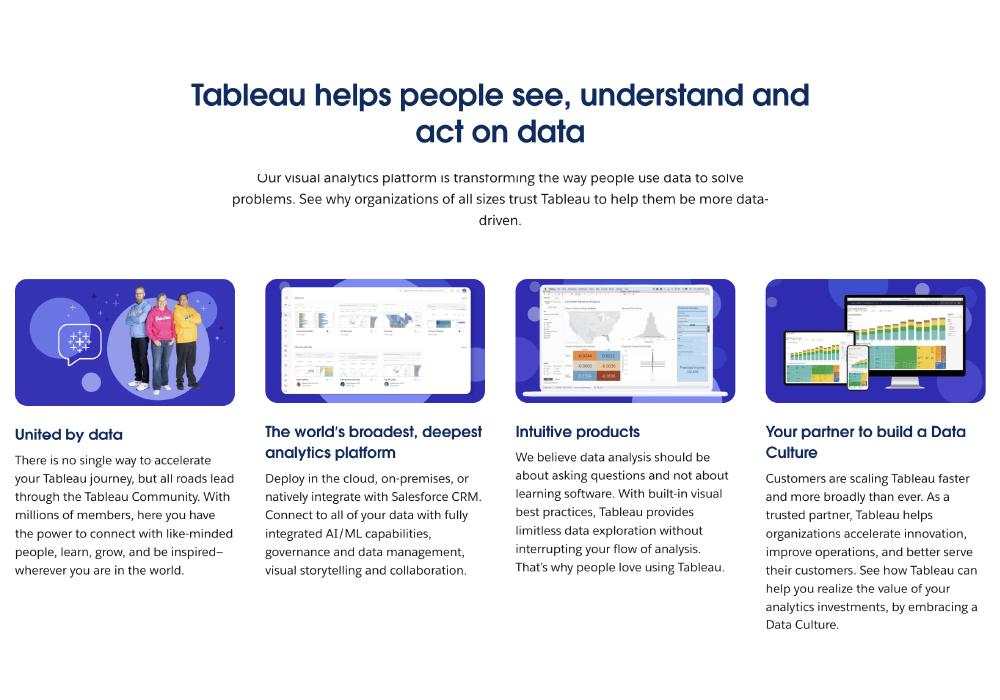
Tableau enables self-service analytics for users at every level. Analysts can build detailed dashboards, while business users can interact with visualizations without coding or scripting.
Teams can explore trends, customize views, and generate reports on the fly. This democratization of data makes analytics more accessible, fostering a culture where insights flow naturally through all departments.
Intelligence at Work: AI-Powered Analytics in Tableau
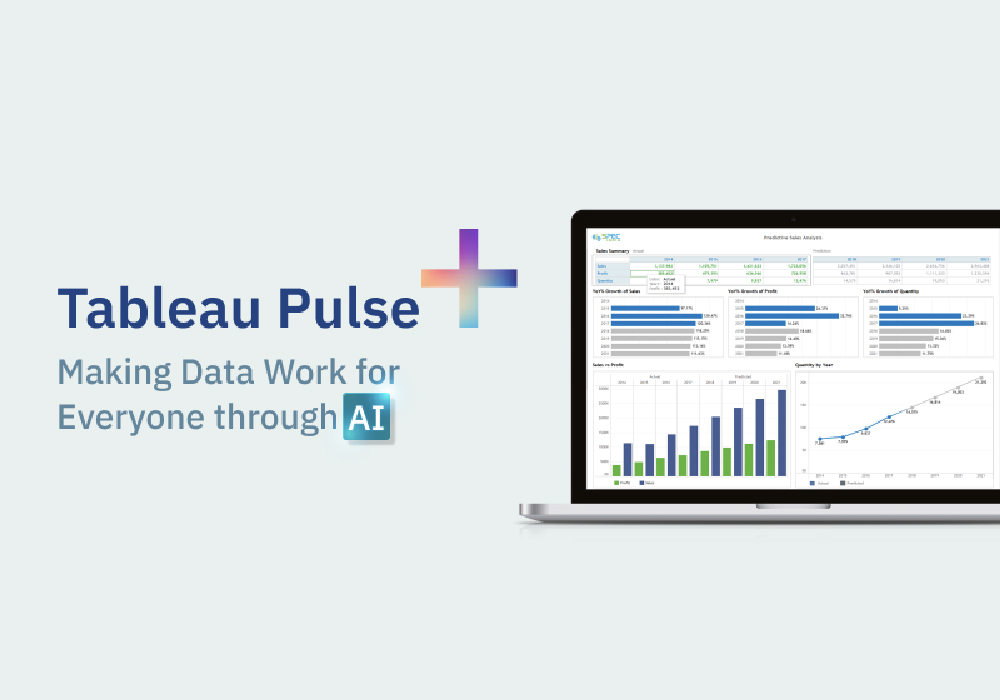
Tableau leverages augmented analytics to make insights smarter. Built-in AI features detect trends, suggest patterns, and answer questions in natural language, helping users discover insights faster and with less manual effort.
These smart analytics tools ensure teams can respond to business challenges proactively, rather than reacting after the fact.
Flexible Deployment: Cloud, On-Premises, or Hybrid
Tableau offers multiple deployment options to suit any organization: fully hosted cloud solutions for ease of access, on-premises installations for tighter control, or hybrid models to balance flexibility and governance.
This versatility allows businesses to scale analytics capabilities while keeping data secure and accessible for all team members.
Choose Your Level: Tableau Subscription Plans
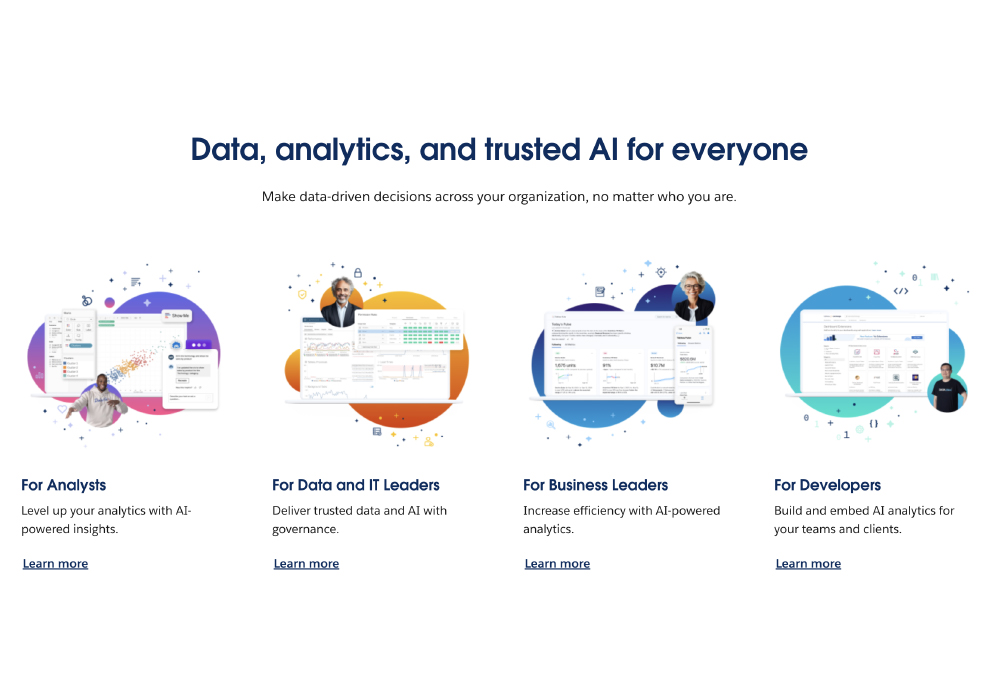
Tableau uses a role-based subscription model to match users with the right level of access:
- Creator: Full access to data preparation, visualization, and analytics for building dashboards.
- Explorer: Designed for users who interact with and analyze dashboards but do not author content.
- Viewer: For team members who consume insights without creating dashboards.
This tiered approach ensures businesses pay for the capabilities their teams actually use while providing flexibility to scale as needs grow.
From Insight to Action: Why Tableau Drives Business Growth
Tableau helps organizations transform raw data into actionable insights. By providing interactive visualizations and real-time dashboards, it enables teams to make faster, smarter decisions.
Benefits include improved operational efficiency, predictive insights for strategic planning, collaboration across departments, and a stronger data-driven culture that drives measurable business outcomes.
Conclusion: Turning Analytics into Competitive Advantage
Tableau is more than a visualization tool, it’s a platform that empowers organizations to see, understand, and act on data. By combining intuitive dashboards, AI-powered analytics, flexible subscriptions, and deployment options, Tableau enables businesses to move from reactive reporting to proactive, insight-driven decisions.
In a world where speed and clarity determine success, Tableau transforms data from a static resource into a strategic asset, helping teams stay agile, informed, and competitive.
Visit Site