


In the early days of the internet, “success” was measured by hits and pageviews. If the counter on your website went up, you were winning. But in today’s complex economy of SaaS platforms, mobile apps, and digital ecosystems, a pageview tells you almost nothing. It doesn’t tell you why a user dropped off during checkout, which feature drives the most retention, or which path leads to a “power user” conversion.
Most companies are “data-rich but insight-poor.” They have mountains of information stored in Google Analytics or internal databases, but they lack the tools to ask that data a simple question: What are my users actually doing?
Mixpanel is the antidote to this digital blindness.
As the industry leader in event-based analytics, Mixpanel moves beyond surface-level metrics. It allows product teams, marketers, and engineers to track specific actions—clicks, swipes, sign-ups, and shares—to build a high-definition picture of the user journey. It’s not just about seeing who came to your site; it’s about understanding the “why” behind every interaction.
Why Traditional Analytics Are Holding Your Product Back
The “Legacy” approach to data is failing modern product teams for three reasons:
- The “What” vs. the “Who”: Traditional tools tell you what happened (1,000 visits), but not who did what (which of those visits came from your highest-paying cohort?).
- Technical Bottlenecks: In the past, if a product manager wanted a custom report, they had to wait weeks for a data scientist to write a SQL query.
- Lagging Indicators: Seeing that your churn rate went up last month is a “post-mortem.” You need real-time data to fix the leak while it's happening.
- The “Average” Trap: Averages hide the truth. You need to segment your data by device, region, and behavior to see the real story.
Mixpanel eliminates these hurdles by putting the power of deep data exploration directly into the hands of the people building the product.
A Suite Built for “Product-Led” Growth
1. Event-Based Tracking (The Core Engine)
Mixpanel doesn't just track URLs; it tracks “Events.”
- Infinite Granularity: Track every “Add to Cart,” “Video Play,” or “Feature Toggle” as a distinct event.
- Properties & Attributes: Attach data to those events. Don't just track “Purchase”—track “Purchase” where “Item = TechRevv Pro” and “User_Type = Startup.”
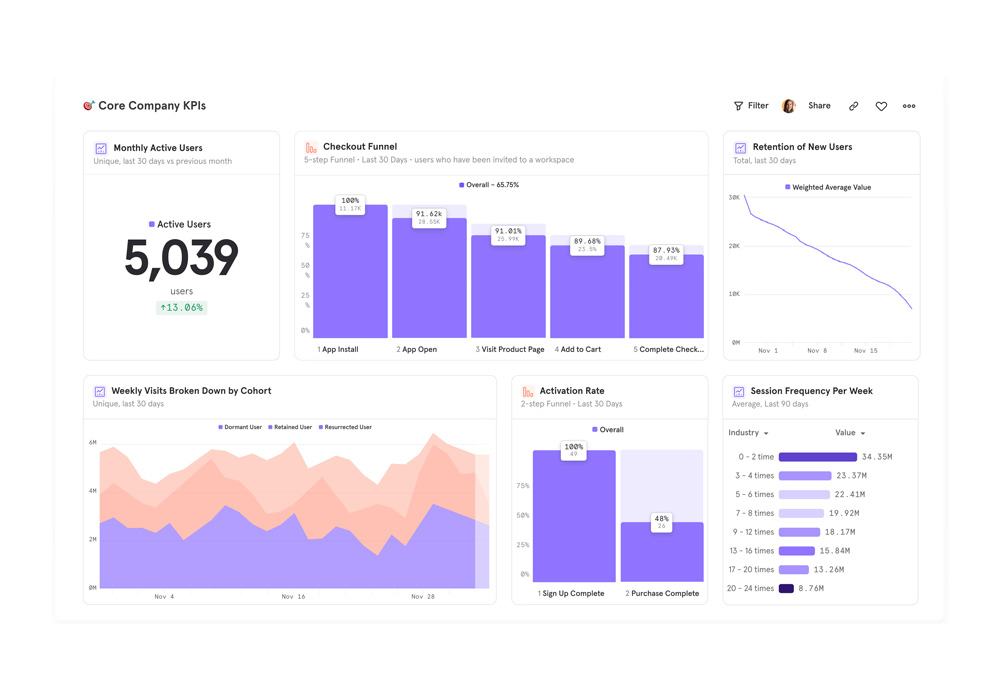
2. Funnels & Conversion Analysis
Identify exactly where your “leaky bucket” is.
- Drop-off Visualization: Build a five-step funnel (Land > Sign Up > Onboard > Create Project > Pay) and see precisely where users are quitting.
- Conversion Trends: Track how your conversion rate changes over time as you release new updates or marketing campaigns.
3. Retention & Cohort Analysis
The secret to a billion-dollar company isn't just getting users; it’s keeping them.
- Retention Tables: See how many users who signed up in Week 1 are still active in Week 10.
- Frequency Reports: Identify your “Power Users.” What do the people who use your app 5x a day have in common? Use those insights to nudge other users toward the same behavior.
4. Signal & Impact (The AI Layer)
Mixpanel uses machine learning to find the “Aha! Moment.”
- Correlation Identification: The “Signal” feature automatically tells you which actions are most highly correlated with long-term retention.
- Impact Reports: Measure the “before and after” of a feature launch. Did that new UI actually improve user engagement, or did it just move the needle for 24 hours?
How Mixpanel Works: From Integration to Insight
- Define Your Events: Identify the 5–10 “Critical Actions” that define success in your app.
- Quick Integration: Use Mixpanel’s SDKs (available for JavaScript, Python, iOS, Android, and more) to start sending data in minutes.
- Build Your Dashboard: Use the drag-and-drop interface to create real-time visualizations for your team.
- Experiment & Iterate: Use the data to form a hypothesis (e.g., “Removing this form field will increase sign-ups by 10%”) and track the results in real-time.
Built for Every Stakeholder
- Product Managers: Validate your roadmap with hard data instead of “gut feelings.”
- Growth Marketers: Identify which ad campaigns are bringing in users who actually use the product, not just those who click the link.
- Data Engineers: Free up your time by giving non-technical teammates a “self-serve” data tool that doesn't require SQL.
- Founders: Get the “Investor-Ready” metrics you need to show true product-market fit and retention curves.
Scalable Plans for Every Stage
- Free Tier: An incredibly generous starting point that allows for up to 20M monthly events—perfect for startups finding their footing.
- Growth Plan: Unlocks advanced saved reports, data modeling, and unlimited teammates as you begin to scale.
- Enterprise: Focuses on high-level security (SOC2/GDPR), automated data auditing, and “Group Analytics” for B2B companies tracking account-level health.
Conclusion: Data is the New Intuition
In the digital age, the “gut feeling” is dead. The companies that dominate their industries are the ones that treat their product as a living, breathing experiment.
Mixpanel transforms your data from a static “report card” into a dynamic growth engine. By moving beyond the pageview and focusing on the actual human behaviors that drive value, it allows you to build products that people don't just visit—but products they can't live without.
Visit Site