


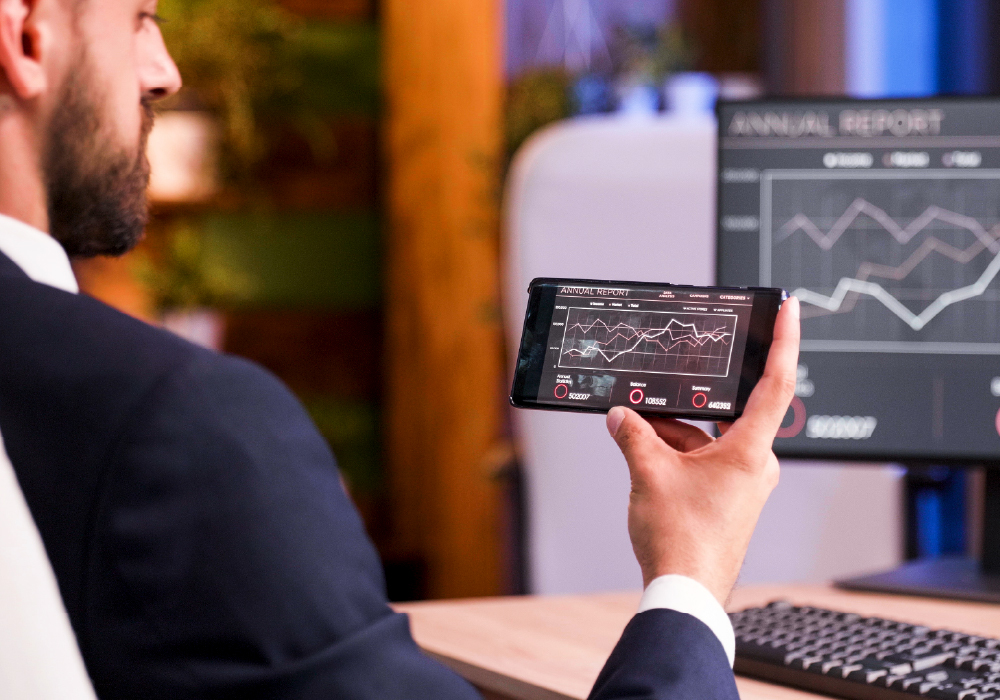
Just like in any other industry, data- driven platforms have become indispensable tools for traders and investors who want to give their decisions a solid market basis. Finviz, a derivation of financial visualizations, is one of the top market research tools used for the stock market. Users can analyze stocks, keep track of market trends, and even discover potential opportunities by way of neat visuals and well organized data.
One of the reasons Finviz is so popular among its users is because it helps in demystifying financial jargon and information. Rather than leaving users with raw numbers for self interpretation, Finviz shows them the insights through charts, heatmaps, and well structured tables. This not only makes people's life easier, but it also allows newcomers to the investment world to do market analysis.
Finviz Explained: Turning Market Numbers Into Visual Stories
It is a financial online platform that is meant for research and stock understanding as well as market behavior, changing easy complex data into a form that is visually digestible to the user. Its data visualization aspect is combined with the screeners of high capacity to give the users the ability to compare companies, assess the performance, and discover the trends. Moreover, the platform possesses price action, valuation metrics, earnings data, technical indicators, and a plethora of other financial stuff.
The intent behind the creation of Finviz is essentially to facilitate the understanding of financial data by users. By making a good visual representation of the information, it is possible for users to get the hold of their chances and threats almost immediately without having to be experts in advanced finance. This feature of being simple yet informative is a combination.
Why Traders and Investors Keep Coming Back to Finviz
One of the main reasons Finviz has become popular among investors is that it provides handy tools without burdening the user with too much information. Its interface is neat, straightforward, and easy to move around, which speeds up and facilitates research. Newcomers as well as seasoned traders appreciate the presentation and organization of the data.
Users of the platform are able to change views, check several stocks at a time, and get an immediate idea of market sentiment. Thanks to this flexibility, Finviz is a good fit for various trading approaches, including long-term investment and short-term market analysis.
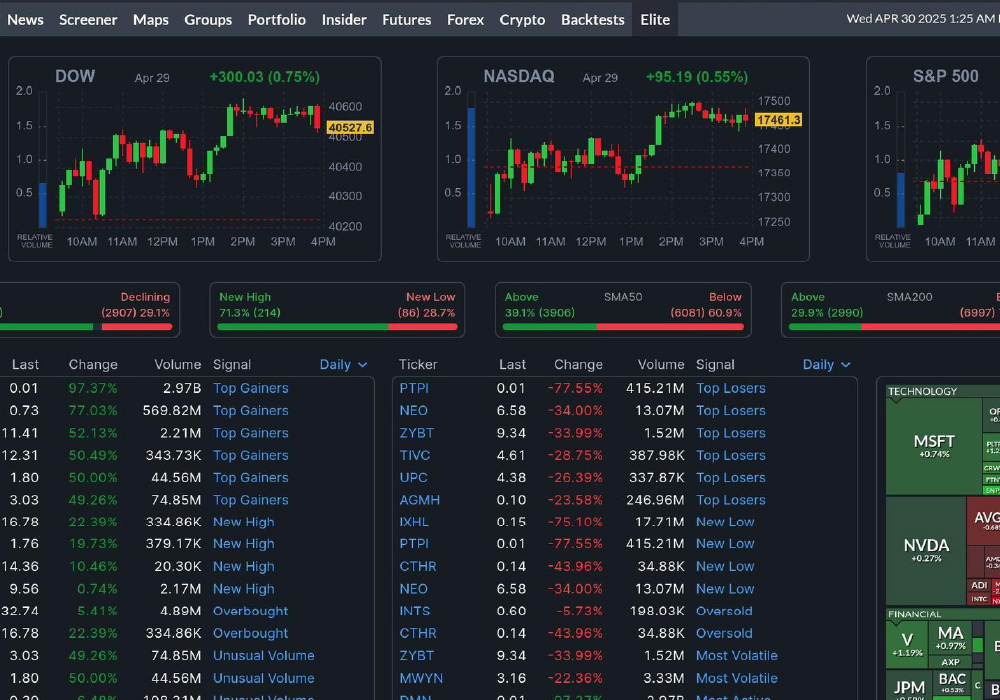
Finding Winning Stocks in Minutes With Finviz Screener
The stock screener is one of the most important tools on Finviz. It helps users filter stocks based on specific criteria so they can focus only on relevant opportunities.
- Users can screen stocks based on fundamentals, technical indicators, and performance metrics.
- Results are displayed in an organized table that allows easy comparison between companies.
This feature reduces the need to manually analyze individual stocks and helps users quickly narrow down options that match their investment strategy.
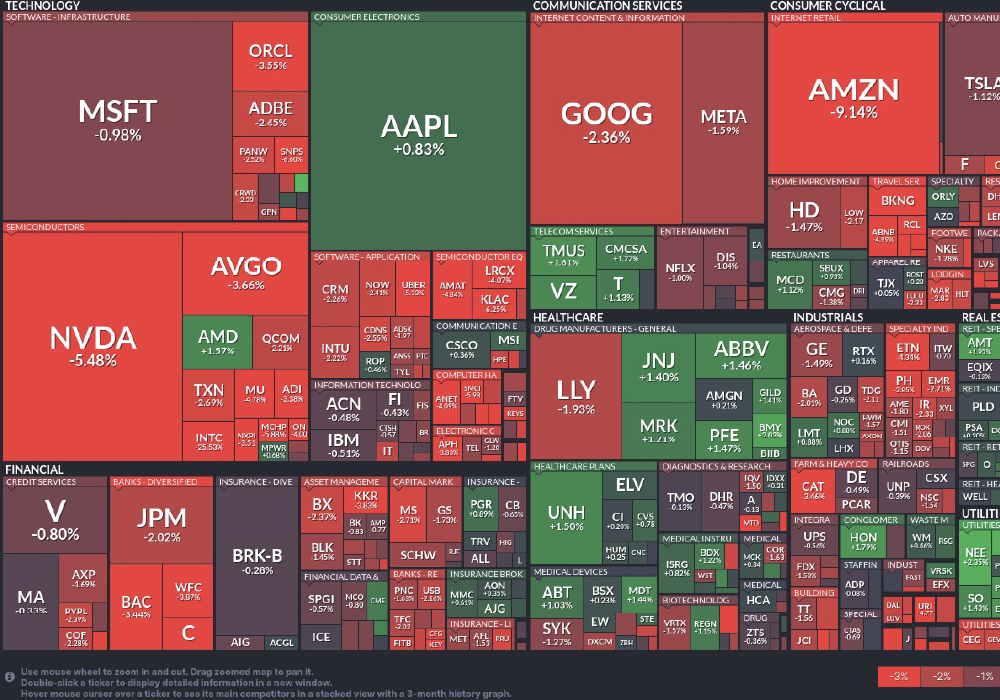
A Color-Coded View of the Market at a Glance

One more major attribute of Finviz is its market heatmaps. Through these heatmaps, users can get a quick visual summary of the performance of different sectors and stocks. The use of colors to indicate gains and losses makes it very simple to grasp the overall market trend just by a quick look.
Heatmaps can be considered a very efficient tool particularly when it comes to sector identification in terms of their strength or weakness. Instead of going through different reports, the users can just by a glance, know which sectors of the market are leading and which are lagging. Such visual transparency helps in getting a sense of the overall market sentiment.
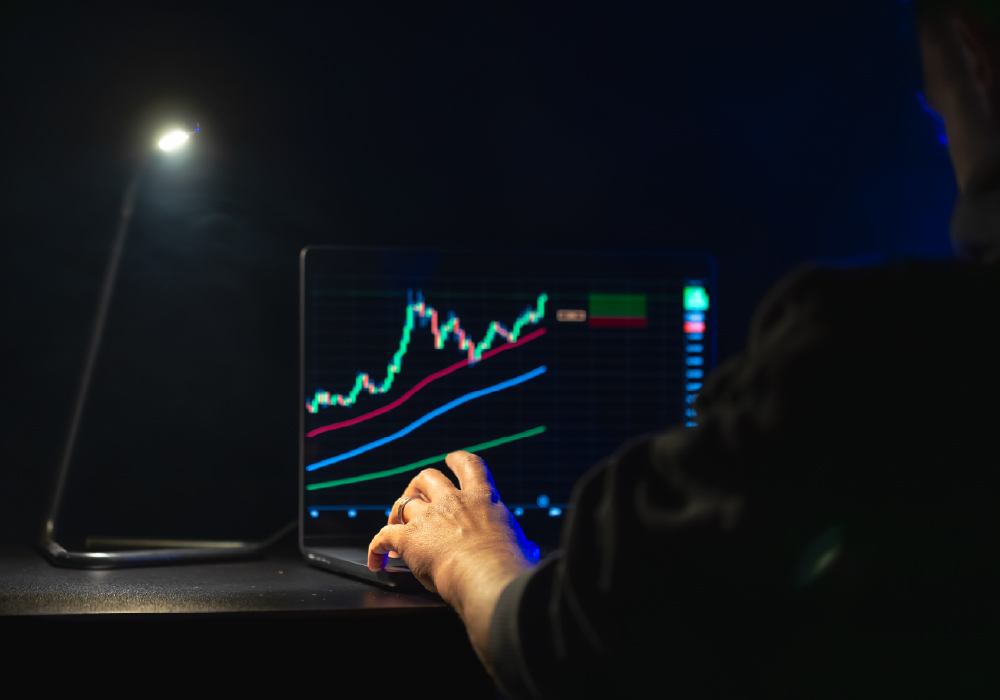
Reading Price Trends Through Clean and Powerful Charts

Finviz has a nice range of interactive charts that can be used one way or another to do technical analysis from basic level to intermediate. By means of these charts, the users are able to check price trends, see how the stock has performed in the past, and even apply some indicators that are commonly used. The site mainly emphasizes simplicity and charts are made in a way that they are easy to understand.
For technical signal dependent traders, Finviz supplies them with sufficient tools to locate their potential entries and exits. Even if a person doesn't have much technical knowledge, they can still get a lot of help from the way price changes and trends are visually demonstrated.
Connecting Market Moves With News and Insider Actions
Finviz also helps users stay informed by combining market data with relevant news and insider activity.
- Financial news related to specific stocks is displayed alongside performance data.
- Insider trading information shows buying or selling activity by company executives.
This combination allows users to connect market movements with real-world events and management behavior, which can add valuable context to investment decisions.
Free Tools or Advanced Power: Choosing the Right Finviz Plan
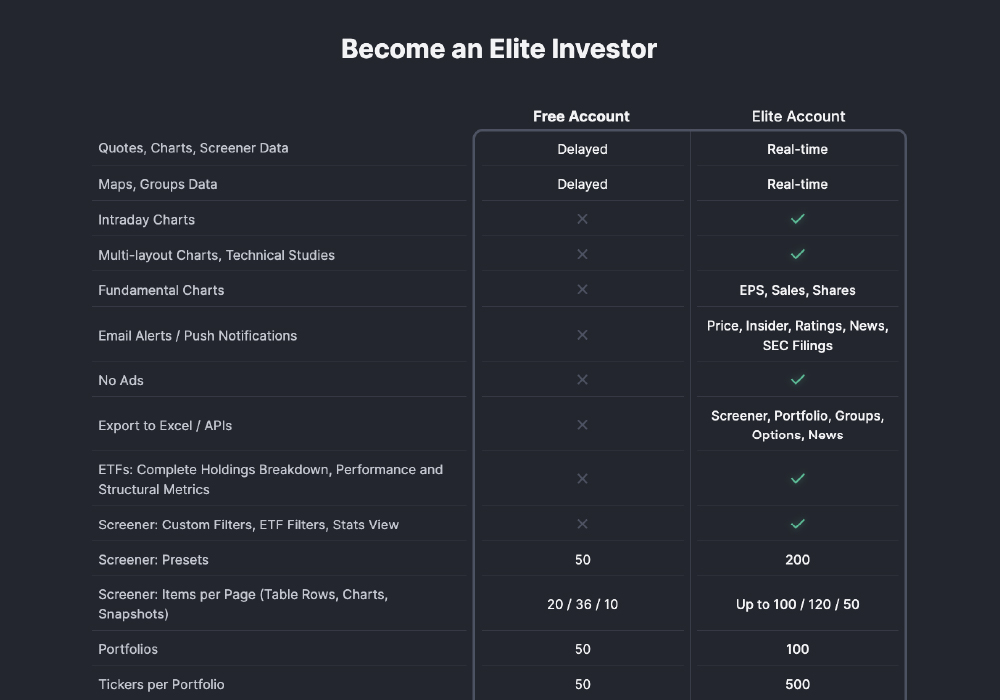
Finviz follows a freemium model, making it accessible to a wide audience. The free version includes essential tools such as the stock screener, delayed market data, basic charts, and heatmaps. For many users, these features are sufficient for regular research and analysis.
The premium version offers enhanced functionality, including real-time data, advanced charting, and additional customization options. This version is more suitable for active traders who require faster data and deeper insights.
Built for Beginners, Traders, and Long-Term Investors Alike
Finviz is designed for a broad range of users. Beginners can use it to learn how markets work and understand stock performance visually. Long-term investors can compare fundamentals and track sector trends. Active traders can scan for short-term opportunities using technical indicators.
Because the platform supports multiple strategies, it adapts well to different levels of experience and investment goals.
From Data to Decisions: Using Finviz the Smart Way
Finviz helps users make more informed decisions by organizing data in a clear and logical way. Instead of relying on guesswork, users can evaluate opportunities based on financial metrics, price trends, and market sentiment.
Regular use of Finviz encourages disciplined research. It helps reduce emotional decision-making and promotes a more analytical approach to investing, which is essential for long-term success in financial markets.
Final Thoughts
Finviz has established itself as a reliable and user-friendly stock market analysis platform. Its ability to combine data, visuals, and screening tools makes it a valuable resource for anyone interested in understanding the markets better.
Whether you are exploring investing for the first time or refining an existing strategy, Finviz offers tools that simplify research and improve clarity. With its balance of accessibility and depth, it continues to be a preferred choice for investors and traders worldwide.
Visit Site